Monitoring
The Monitoring section in the Cloud Management Portal offers real-time visibility into the health and performance of your Kubernetes cluster. It provides granular, node-level metrics across multiple dimensions including CPU usage, memory consumption, disk operations, and network activity—empowering DevOps teams to make data-driven decisions and maintain optimal resource utilization.
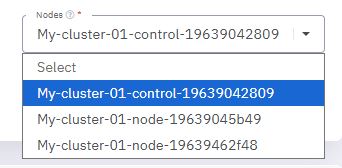
1. Node Selection :
Users can easily select individual nodes from the cluster to view specific metrics. A dropdown menu lists all cluster nodes:
-
Example:
My-cluster-01-control-19639042809 -
Example:
My-cluster-01-node-19639045b49 -
Example:
My-cluster-01-node-19639462f48
This facilitates focused monitoring and troubleshooting for each node in isolation.
2. Time Range Filters :
The monitoring dashboard supports multiple time-range filters to analyze short-term spikes or long-term trends:
-
1 Hour
-
6 Hours
-
12 Hours
-
24 Hours
The refresh button allows for real-time data synchronization.

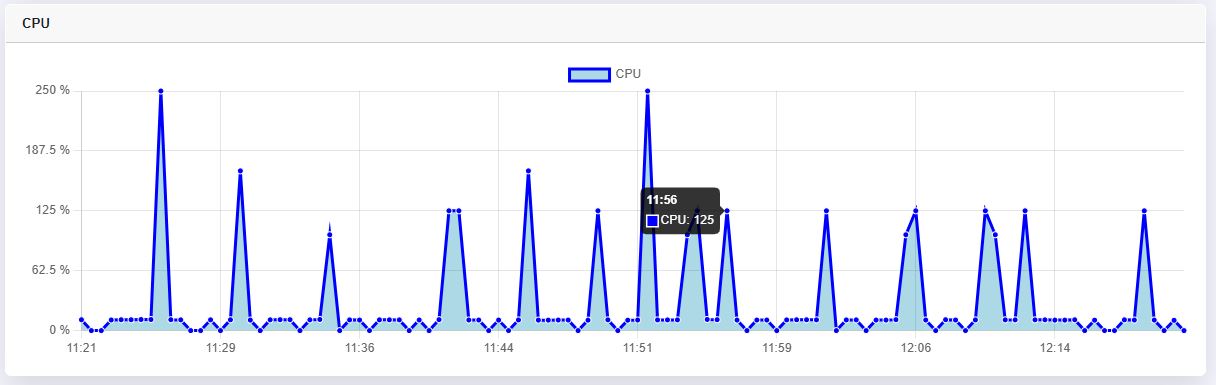
3. CPU Usage :
A dedicated panel displays CPU utilization (%) with time-based granularity. This helps in identifying performance bottlenecks or unexpected spikes in compute load.
-
Metric: CPU usage in percentage
-
Graph View: Line chart with real-time updates
-
Insights: Track CPU-intensive operations and scale accordingly.
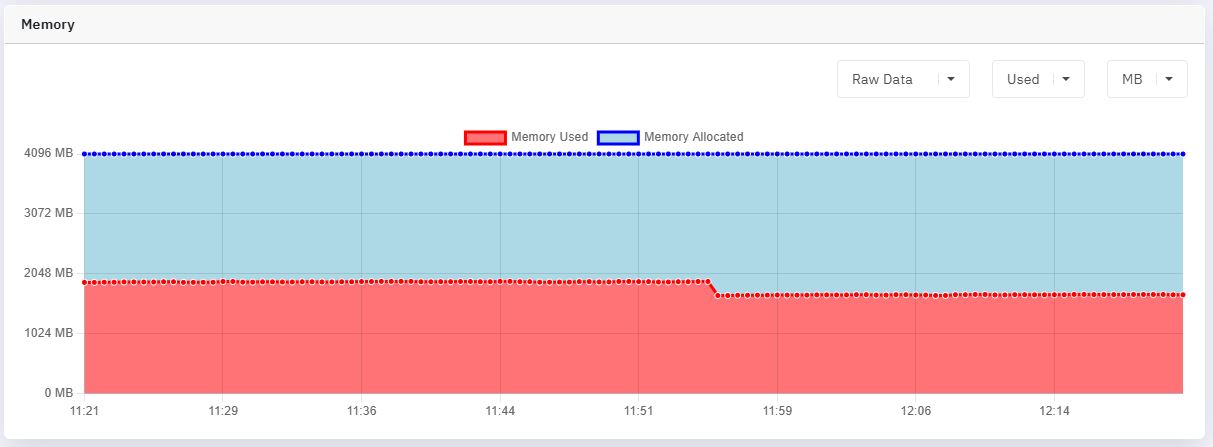
4. Memory Usage :
This section visualizes how much memory is allocated versus how much is actively used.
-
Red: Memory Used
-
Blue: Memory Allocated
-
Units: Display in MB (customizable)
-
Utility: Prevent memory overprovisioning or leaks
Options like Raw Data, Used, and other unit toggles enhance the analytical capabilities.
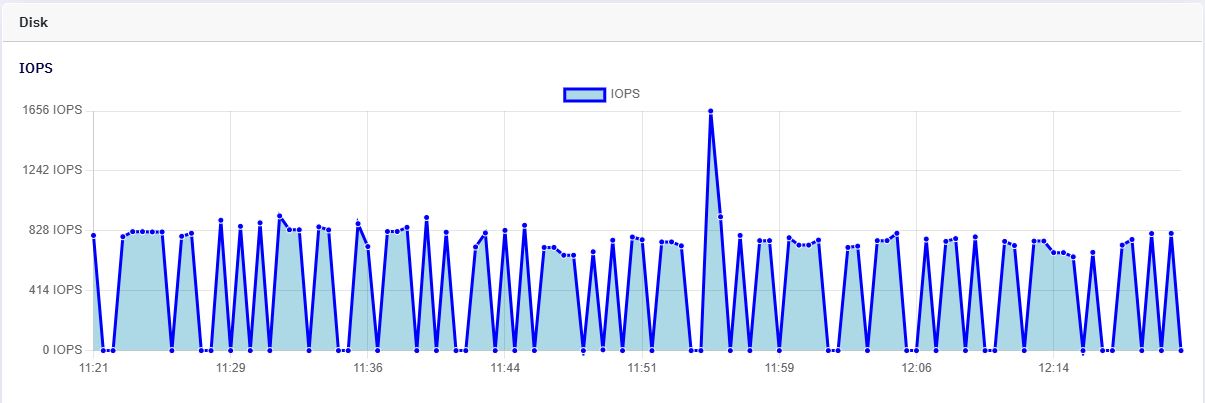
5. Disk IOPS :
Displays the Input/Output Operations Per Second (IOPS), a key metric for understanding disk performance.
-
Metric: IOPS over time
-
Visualization: Spikes and dips indicating load patterns
-
Usage: Optimize volume allocation and disk-intensive workloads.
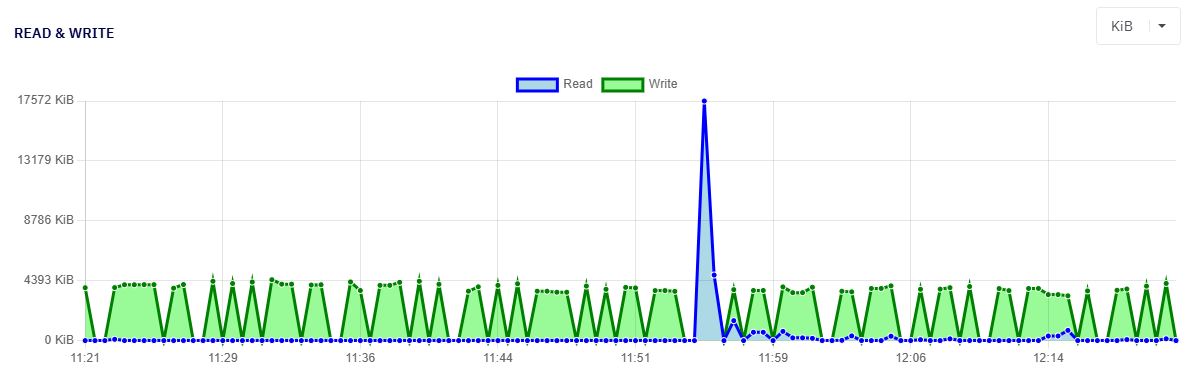
6. Disk Read & Write :
Breakdown of Read and Write activity measured in KiB:
-
Blue Line: Disk Read operations
-
Green Line: Disk Write operations
-
Insight: Identify heavy write workloads and balance storage strategies
This section supports unit toggling for greater precision in data representation.
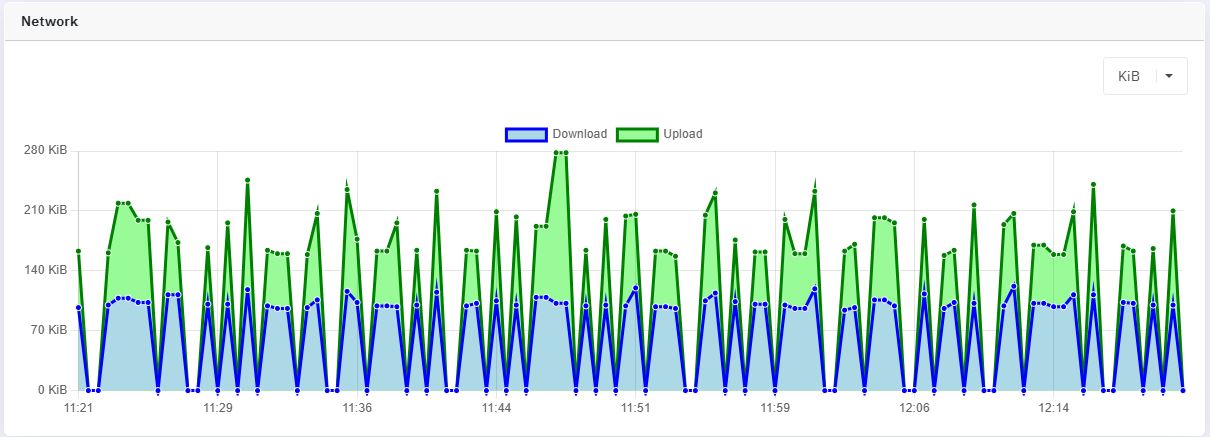
7. Network Traffic :
Monitors Download and Upload data throughput for each node.
-
Blue Line: Download activity
-
Green Line: Upload activity
-
Units: KiB
-
Benefit: Ensure balanced bandwidth usage and detect anomalies.