Dashboard Overview
The Dashboard in the Cloud Management Portal serves as the central hub for monitoring and managing cloud resources. It provides a comprehensive overview of usage statistics, billing information, and system notifications, helping users make informed decisions regarding their cloud infrastructure.
The dashboard enables users to:
-
Track real-time and historical resource usage.
-
Monitor billing and forecast future expenses.
-
View allocated and available quotas for cloud resources.
-
Access system alerts and notifications related to instance activity.
-
Quickly deploy new virtual machines (VMs) and manage configurations.
Key Sections of the Dashboard
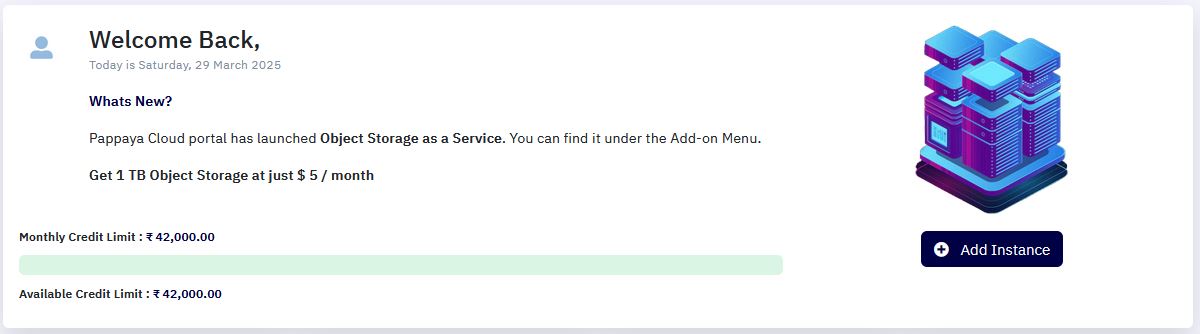
1. User Welcome Panel :
Located at the top of the dashboard, this section provides a personalized greeting along with useful information related to the account, such as:
-
User Name: Identifies the logged-in user.
-
Quick Tips: Provides guidance on navigating the portal and utilizing available features.
2. Billing Summary :
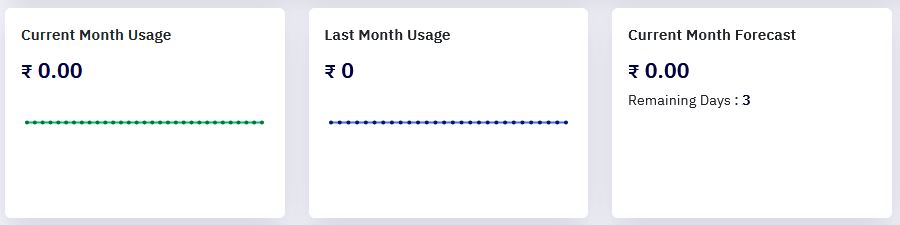
The billing section helps users track cloud usage costs efficiently. It consists of:
-
Current Month’s Usage: Displays the total cloud usage cost for the current billing cycle.
-
Last Month’s Usage: Provides a comparison of the previous month’s total expenses.
-
Forecasted Cost: Predicts the estimated cost for the current month based on current resource consumption trends.
-
Processing Charges: Shows any additional charges related to transactions or configurations.
This section is crucial for budget planning and ensuring cost efficiency in cloud resource utilization.
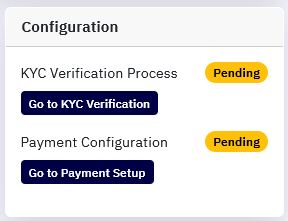
3. Configuration Status :
-
This section provides real-time updates on critical configurations related to cloud services such as KYC, Payment configuration.
-
A "Completed" status ensures that configurations are successfully applied, whereas "Pending" indicates pending actions.
4. Statistics & Resource Consumption Trends :

This section offers a graphical representation of usage statistics over time. Users can view:
-
Resource Utilization Trends: A historical breakdown of cloud resource consumption, helping in capacity planning.
-
Usage by Month: Tracks the monthly variations in cloud usage, allowing users to identify peak usage periods.
-
Performance Metrics: Helps users optimize their cloud resource allocation based on past usage patterns.
This visual representation is helpful in monitoring performance trends and making data-driven decisions.
5. Overview Quotas :
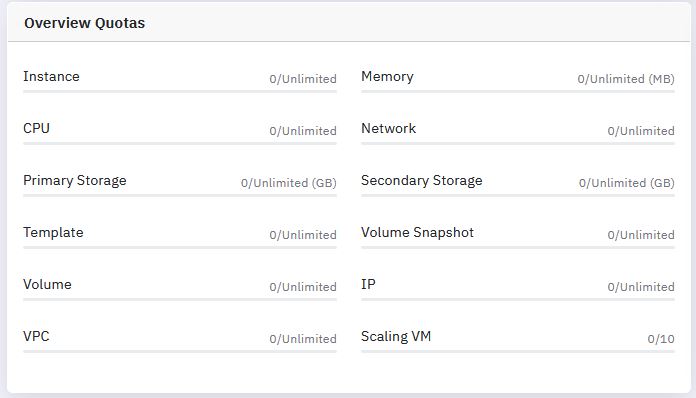
This section provides a breakdown of available and utilized quotas for different cloud resources:
-
Instances: Displays the total number of virtual machines deployed and the remaining quota.
-
CPU: Shows allocated and consumed virtual CPUs (vCPUs) for workloads.
-
Memory: Details the allocated vs. used RAM across instances.
-
Primary Storage: Provides information about total available storage and current utilization.
-
Templates: Lists the number of VM templates stored for quick deployments.
-
VPC (Virtual Private Cloud): Displays the number of virtual networks created and their associated quotas.
Users can use this section to ensure they are within their allocated resource limits and scale resources as needed.
6. Notifications Panel :
The notifications panel provides real-time updates and alerts related to cloud activities, such as:
-
Instance Deployments: Alerts on VM creation, deletion, or configuration changes.
-
Quota Exceeding Warnings: Notifies users when they are approaching or exceeding their allocated resource limits.
-
System Maintenance Alerts: Informs users about scheduled maintenance or potential service downtimes.
-
Security Alerts: Notifies users of any suspicious activity or security updates.
Users can scroll through notifications to stay updated on critical events affecting their cloud infrastructure.