My Activity
The My Activity module in the Cloud Management Portal provides a complete audit trail of user-initiated actions across your cloud environment. It helps you maintain operational transparency, monitor resource operations, and identify potential issues or unauthorized changes by giving you access to a log of activities and alerts.
This section covers how to access, interpret, and make use of the activity log and alert system.
Accessing My Activity
-
Log in to the Cloud Management Portal.
-
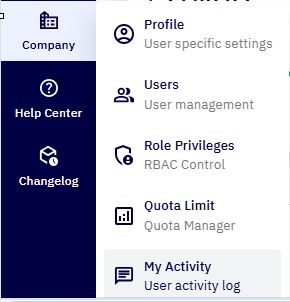
From the left-hand navigation menu, go to Company > My Activity.
-
You will be directed to the Activity Dashboard, which consists of two tabs:
-
Events
-
Alerts
-
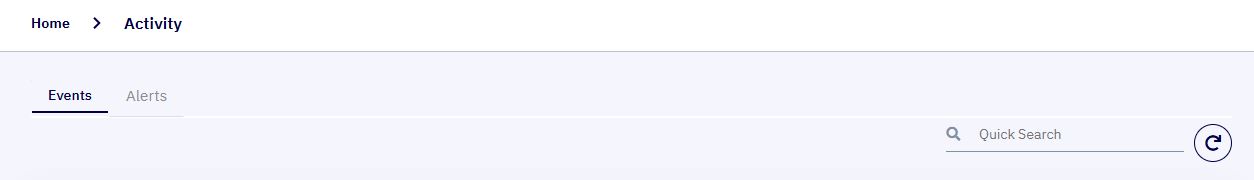
Events Tab
-
The Events tab lists detailed logs of every significant action initiated by users in the portal.
-
These events include VM operations, IP address actions, firewall rule modifications, and more. The event table Columns shown below.
| Column | Description |
|---|---|
| Client | Email ID of the user who performed the action. |
| Description | A brief summary of the event (e.g., VM deleted, IP created). |
| Date | Timestamp of when the event occurred. |
| Status | Current state of the event (e.g., SUCCEEDED, STARTED). |
Sample Events
-
IpAddress 15.6.17.2 deletion completed– Status: SUCCEEDED -
VirtualMachine Demo-A expunge completed– Status: SUCCEEDED -
Firewall rule udp create completed– Status: SUCCEEDED -
VirtualMachine Demo-A destroy started– Status: STARTED
Tip: You can use the Quick Search bar to filter logs by keywords or client email.
Alerts Tab
The Alerts tab is designed to display critical system-level warnings or anomalies that require user or admin attention. Alerts may include issues like failed deployments, resource overuse, or billing notifications.