Instance Summary
VM Summary Page Overview
The VM Summary Page in the Cloud Management Portal provides a consolidated view of all essential information and management actions for an individual virtual machine. This page allows users to monitor, manage, and interact with a VM's lifecycle, configurations, network, and security settings.
1. Accessing VM summary page
-
Login into the cloud management portal.
-
Then navigate to Compute > Instance > Select VM > Summary Tab
Once a virtual machine is selected, the portal displays the instance's summary page by default, presenting real-time operational status, compute configurations, network data, and actionable controls.
2. General Instance Information
-
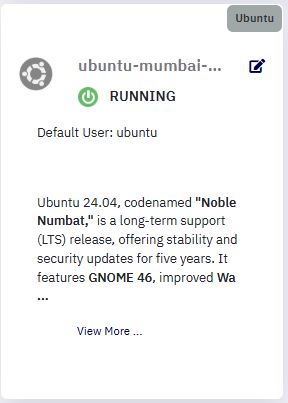
This is located on the top-left panel, this section provides at-a-glance identity details of the selected VM.
-
VM Name: Displays the user-defined name (e.g.,
ubuntu-mumbai-01) . -
Status: Current power state (e.g.,
RUNNING). -
Default User: Default system user (e.g.,
ubuntu).
-
-
Template Summary: Includes operating system version and release notes, e.g.,
"Ubuntu 24.04, codenamed 'Noble Numbat', is a long-term support (LTS) release offering improved stability and security." -
Use the "View More" link to read the complete OS release information.
3. VM Configuration Details
This section outlines the technical and deployment specifications of the virtual machine:
| S. No | Options | Description |
|---|---|---|
| 1 | Compute Offer | The VM flavor or package (e.g., GC_4C8R) showing assigned CPU and RAM specs. |
| 2 | Zone | Physical location of the instance (e.g., MUMBAI). |
| 3 | Public IP | Externally accessible IP (e.g., 154.61.173.193). |
| 4 | Private IP | Internal network IP (e.g., 10.1.1.25). |
| 5 | OS Type | Operating system family (e.g., Other Ubuntu 64-bit). |
| 6 | Template Name | VM image used during deployment (e.g., Ubuntu 24.04 LTS). |
| 7 | HA Enabled | Indicates High Availability status (Yes/No). |
| 8 | Dynamic Scalable | Displays whether the instance supports autoscaling. |
| 9 | SSH Key Pair | Assigned SSH key for authentication (e.g., Login-SSH-Key). |
| 10 | Mounted ISO | Displays any attached ISO files. |
| 11 | Show/Reset Password | Allows password viewing/resetting. Securely managed with permission control. |
| 12 | Created / Updated | Timestamps showing VM creation and last modification. |

4. Available Actions
At the top-right, a series of action buttons allow for VM lifecycle management and customization.
-
Recover :
-
One key capability is the Recover option, which allows users to restore accidentally deleted instances—ensuring operational continuity and data protection.
-
In the Cloud Management Portal, a virtual machine (VM) can exist in two post-deletion states:
- Destroy: This state indicates the VM has been soft deleted. The instance remains recoverable and its associated data is retained.

- Expunge: This state signifies that the VM has been permanently deleted. Once expunged, the VM and its data cannot be restored.
-
If a VM is deleted using the Destroy option, the Recover button becomes available.

-
This allows users to restore the VM—particularly useful in cases where a VM was accidentally deleted and needs to be quickly brought back online.
-
Once a VM enters the Destroy state, the Expunge option becomes available for that instance. You can then choose to permanently remove the VM from the Cloud Management Portal.

-
-
Host Information :
- View the backend host details where VM is deployed.
-
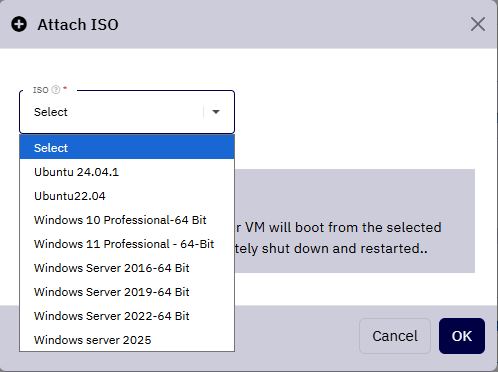
Attach ISO:
-
Mount ISO images for OS installation or troubleshooting.
-
You can able to attach the required ISO from the drop-down list.
-
-
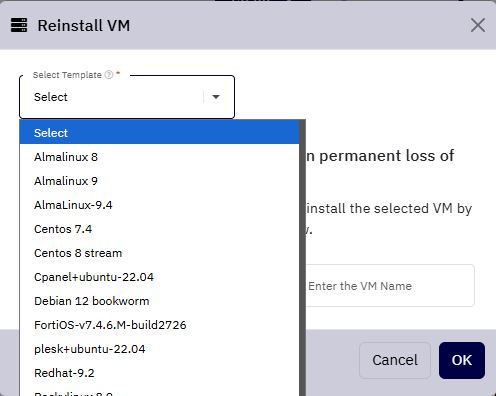
Reinstall:
-
Reprovisions the instance using the same or different template.
-
You can able to attach the required template from the drop-down list.
-
-
Console:
- Opens a direct in-browser console session to the VM.
-
Destroy:
-
Deletes the VM. This action is irreversible.
-
This option allows you to either perform a soft delete or a permanent deletion by enabling the Expunge checkbox.
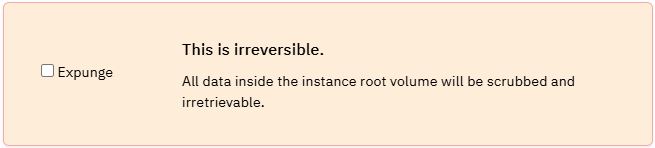
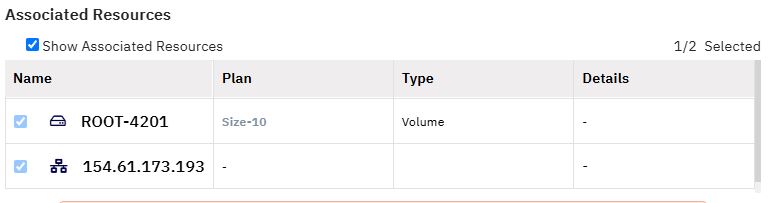
- Additionally, you can view all the resources associated with the selected instance by enabling the Show Associated Resources checkbox.
-
5. Resource Utilization
CPU Monitoring
-
Shows the percentage of virtual CPU used from the total available (e.g., 0.08% of 8000 MHz).
-
Historical graphs display trends over the last 7 days.
Networking Stats
-
Inbound Traffic: Volume of data received by the VM
-
Outbound Traffic: Volume of data sent from the VM.

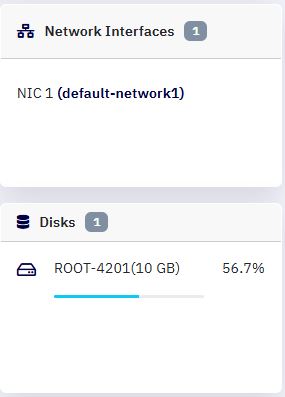
6. Networking & Interfaces
-
Displays the NICs assigned to the VM.
-
Shows network name (e.g.,
default-network1).
7. Storage Information
-
Lists all virtual disks associated with the instance.
-
Example:
ROOT-4201with 10 GB storage. -
Displays usage percentage for each disk.
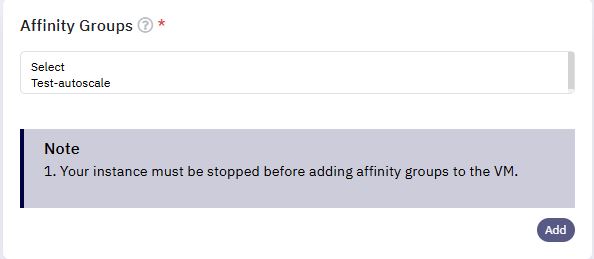
8. Affinity Groups
-
Affinity Groups are designed for advanced orchestration.
-
Choose an existing group (e.g.,
Test-autoscale). -
User must make sure that the VM must be stopped before applying or changing affinity group.
-
Click the
Addbutton after selected the affinity group.