SFS Dashboard
The Shared File Service (SFS) Overview Dashboard in the Cloud Management Portal provides a real-time, at-a-glance view of your shared file storage resource. It consolidates all key operational metrics, mount configurations, and system-level stats into a single intuitive interface.
This guide describes each section of the dashboard in detail and provides instructions on how to interpret and act on the available data.
1. Overview Navigation Tabs
At the top of the interface, the SFS dashboard is organized into the following tabs for ease of access:
-
Overview: Displays essential configuration details, mount instructions, system metrics, and controls.
-
VM List: Lists virtual machines currently attached to this SFS volume.
-
Metrics: Provides deeper usage statistics over time.
-
Logs: Shows event logs for auditing and troubleshooting purposes.

2. Storage Details Panel
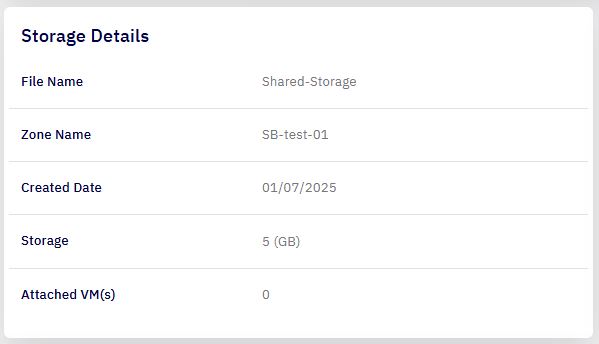
This section gives you a summary of the shared storage resource:
| S. No | Field | Description |
|---|---|---|
| 1 | Name | Name assigned to the SFS service (e.g., Shared-Storage). |
| 2 | Zone Name | The zone or region where the SFS service is provisioned (e.g., SB-test-01). |
| 3 | Created Date | Date when the storage was initially created (e.g., 01/07/2025). |
| 4 | Storage | Allocated storage size for the file system (e.g., 5 GB). |
| 5 | Attached VM(s) | Number of virtual machines currently using the SFS service (e.g., 0). |
3. Mount Point Information
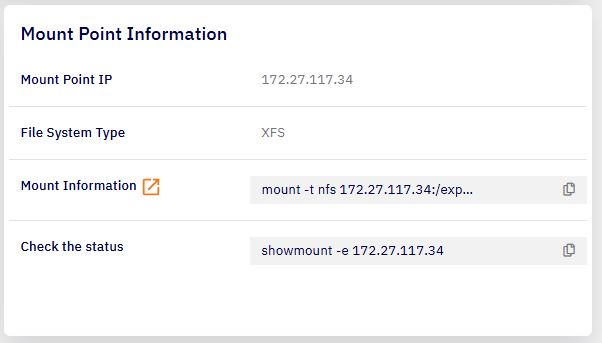
This section provides details and ready-to-use commands for mounting the SFS volume on virtual machines:
| S. No | Field | Description |
|---|---|---|
| 1 | Mount Point IP | Internal IP address used to mount the shared storage (e.g., 172.27.117.34). |
| 2 | File System Type | Indicates the file system format (e.g., XFS). |
| 3 | Mount Information | Ready-to-copy mount command |
4. Memory Usage Graph
A real-time memory usage chart is displayed to help track how much memory the SFS instance is consuming:
-
Memory Used (Red Bar): Reflects the currently consumed memory.
-
Memory Allocated (Blue Bar): Indicates total memory provisioned to the SFS instance.
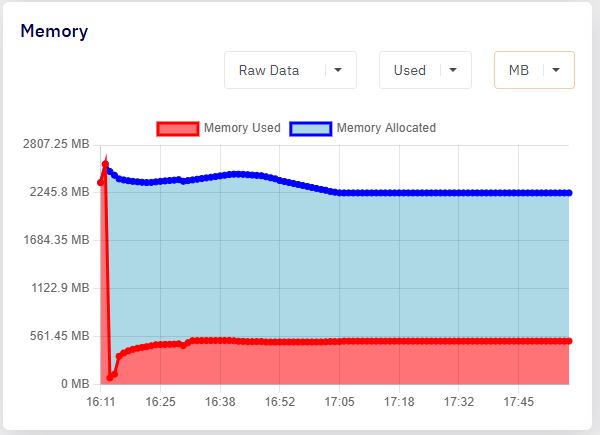
🔍 You can toggle between Raw Data, Used, and Free, and filter by units like MB or GB.
5. Network Speed Panel
This section presents live metrics of network throughput:
-
Download (Blue Line): Current inbound traffic.
-
Upload (Green Line): Current outbound traffic.
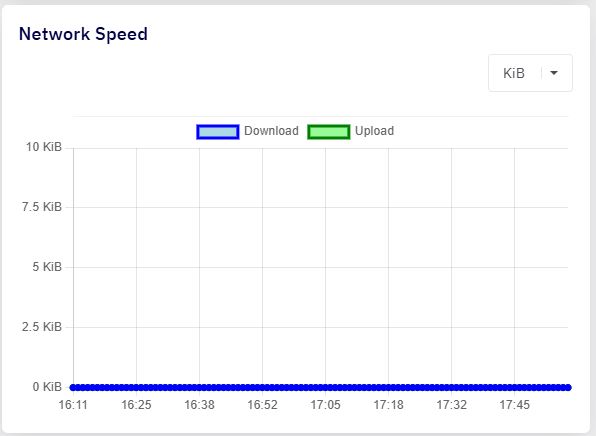
You can filter by data units (e.g., KiB, MiB) for detailed analysis.
6. SFS Service Actions
Located in the upper-right corner, three control buttons allow you to manage the SFS instance:
| S. No | Button | Function |
|---|---|---|
| 1 | Resize | Modify the storage capacity of the SFS volume. |
| 2 | Restart | Restart the SFS service instance if required (e.g., after configuration changes). |
| 3 | Delete | Permanently remove the SFS service (action requires confirmation). |

Caution: Deleting the SFS service will result in the loss of all data unless a backup exists.