Kubernetes Dashboard
The Kubernetes Dashboard is a web-based user interface for managing and monitoring Kubernetes clusters. It provides an overview of cluster resources, allows users to deploy and troubleshoot applications, manage workloads, and view logs and performance metrics. The dashboard simplifies cluster administration by offering a visual representation of deployments, pods, and other Kubernetes objects.
Enabling Kubernetes Dashboard
1. Login to the Kubernetes Control Plane :
-
Use the assigned SSH key to log into the Kubernetes control plane virtual machine (VM).
-
If you're using Windows, you can log in with PuTTY, or if you're on Linux, use the command below to access the VM.
ssh -i <your-ssh-key.pem> cloud@<control-plane-vm-ip> -p <port number>
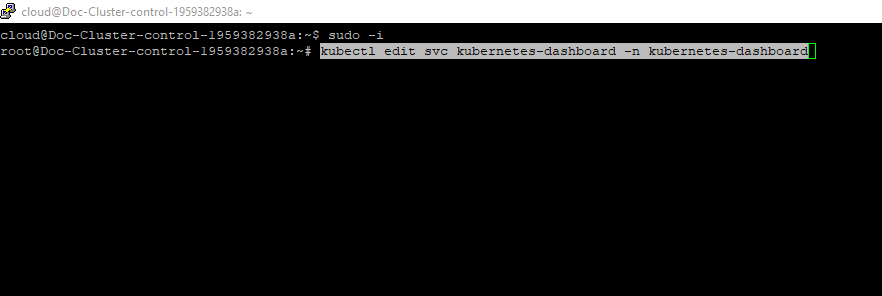
2. Edit the Kubernetes Dashboard Service :
- Modify the dashboard service to expose it on a specific NodePort using below command.
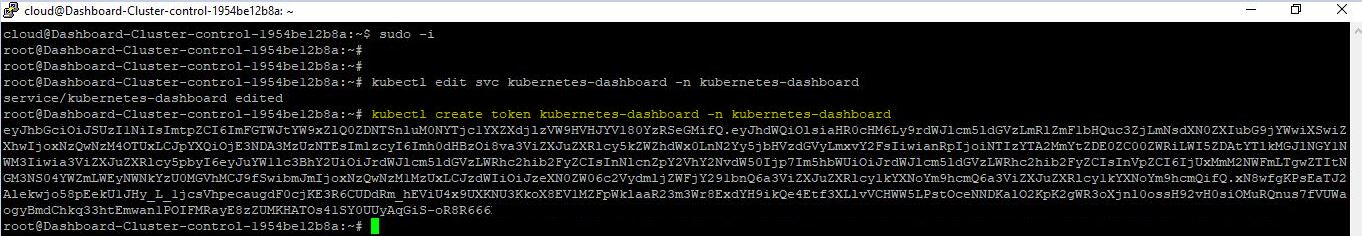
sudo -i
kubectl edit svc kubernetes-dashboard -n kubernetes-dashboard
3. Configure NodePort :
- Locate the
specsection of the service file and add the following lines:
nodePort: 32727 type: NodePort
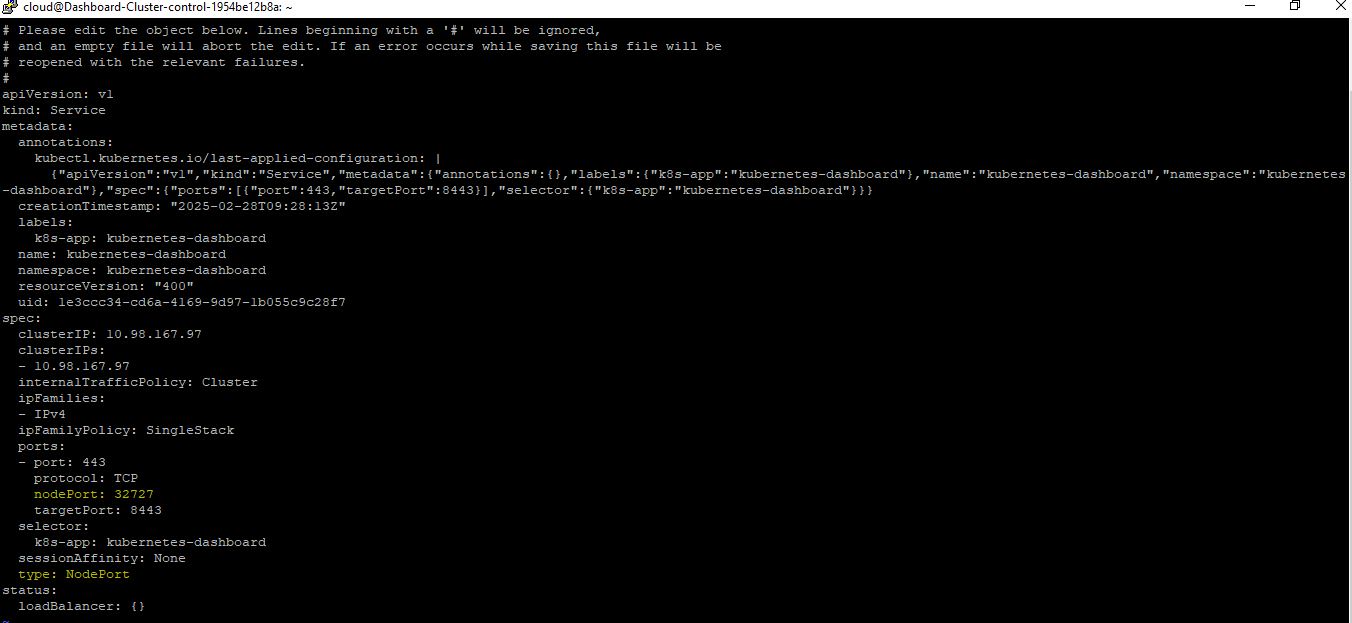
- Save and exit the editor.
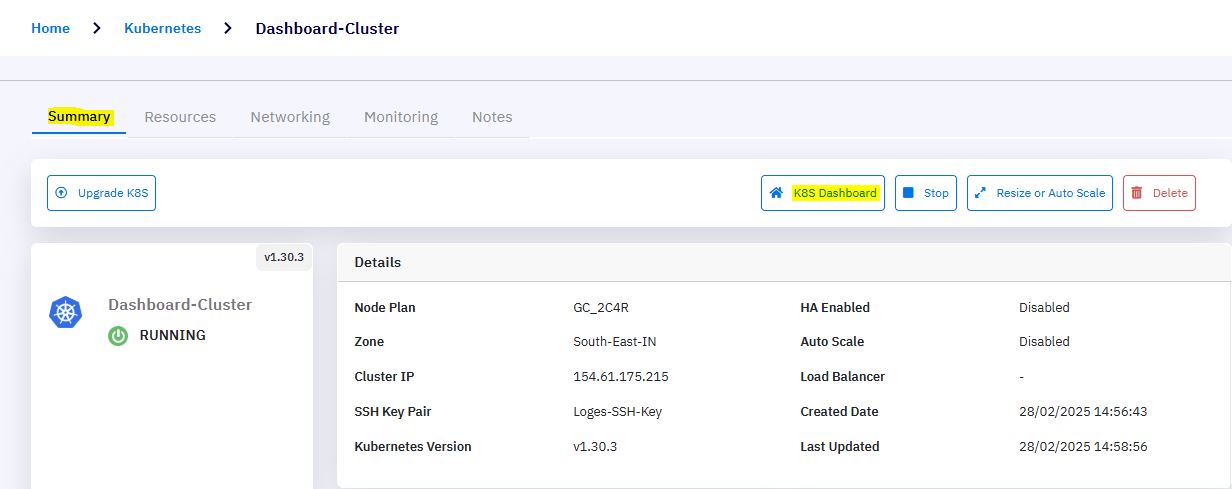
4. Access the Kubernetes Dashboard :
-
Navigate to the Cluster Summary page in the cloud portal.
-
Click on the Kubernetes Dashboard link.
5. Authenticate to the Dashboard :
- The dashboard will prompt for authentication. You can log in using either token (or) Kubernetes config file .
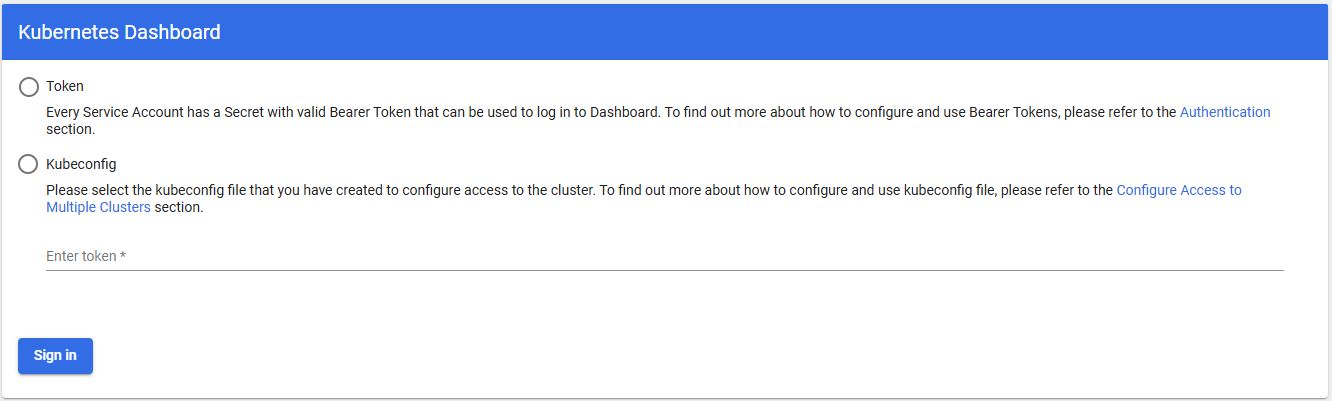
6. Generate an Authentication Token :
- If using a token, generate one by running the following command on the control plane VM:
kubectl create token kubernetes-dashboard -n kubernetes-dashboard
-
Copy the generated token and paste it into the corresponding field on the Kubernetes Dashboard login page.
-
Click Sign-in to proceed.
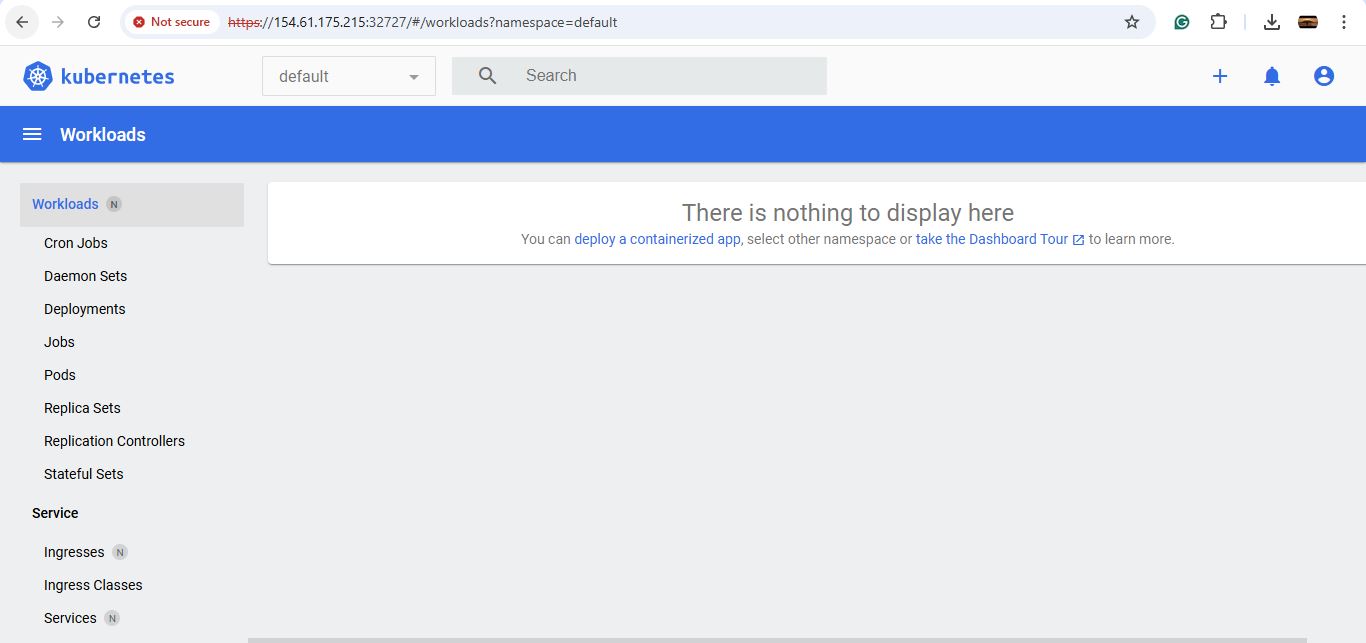
7. Verify Dashboard Access :
- Upon successful authentication, the Kubernetes Dashboard should load, allowing you to monitor and manage your Kubernetes cluster.